12
FINANCIALHIGHLIGHTS
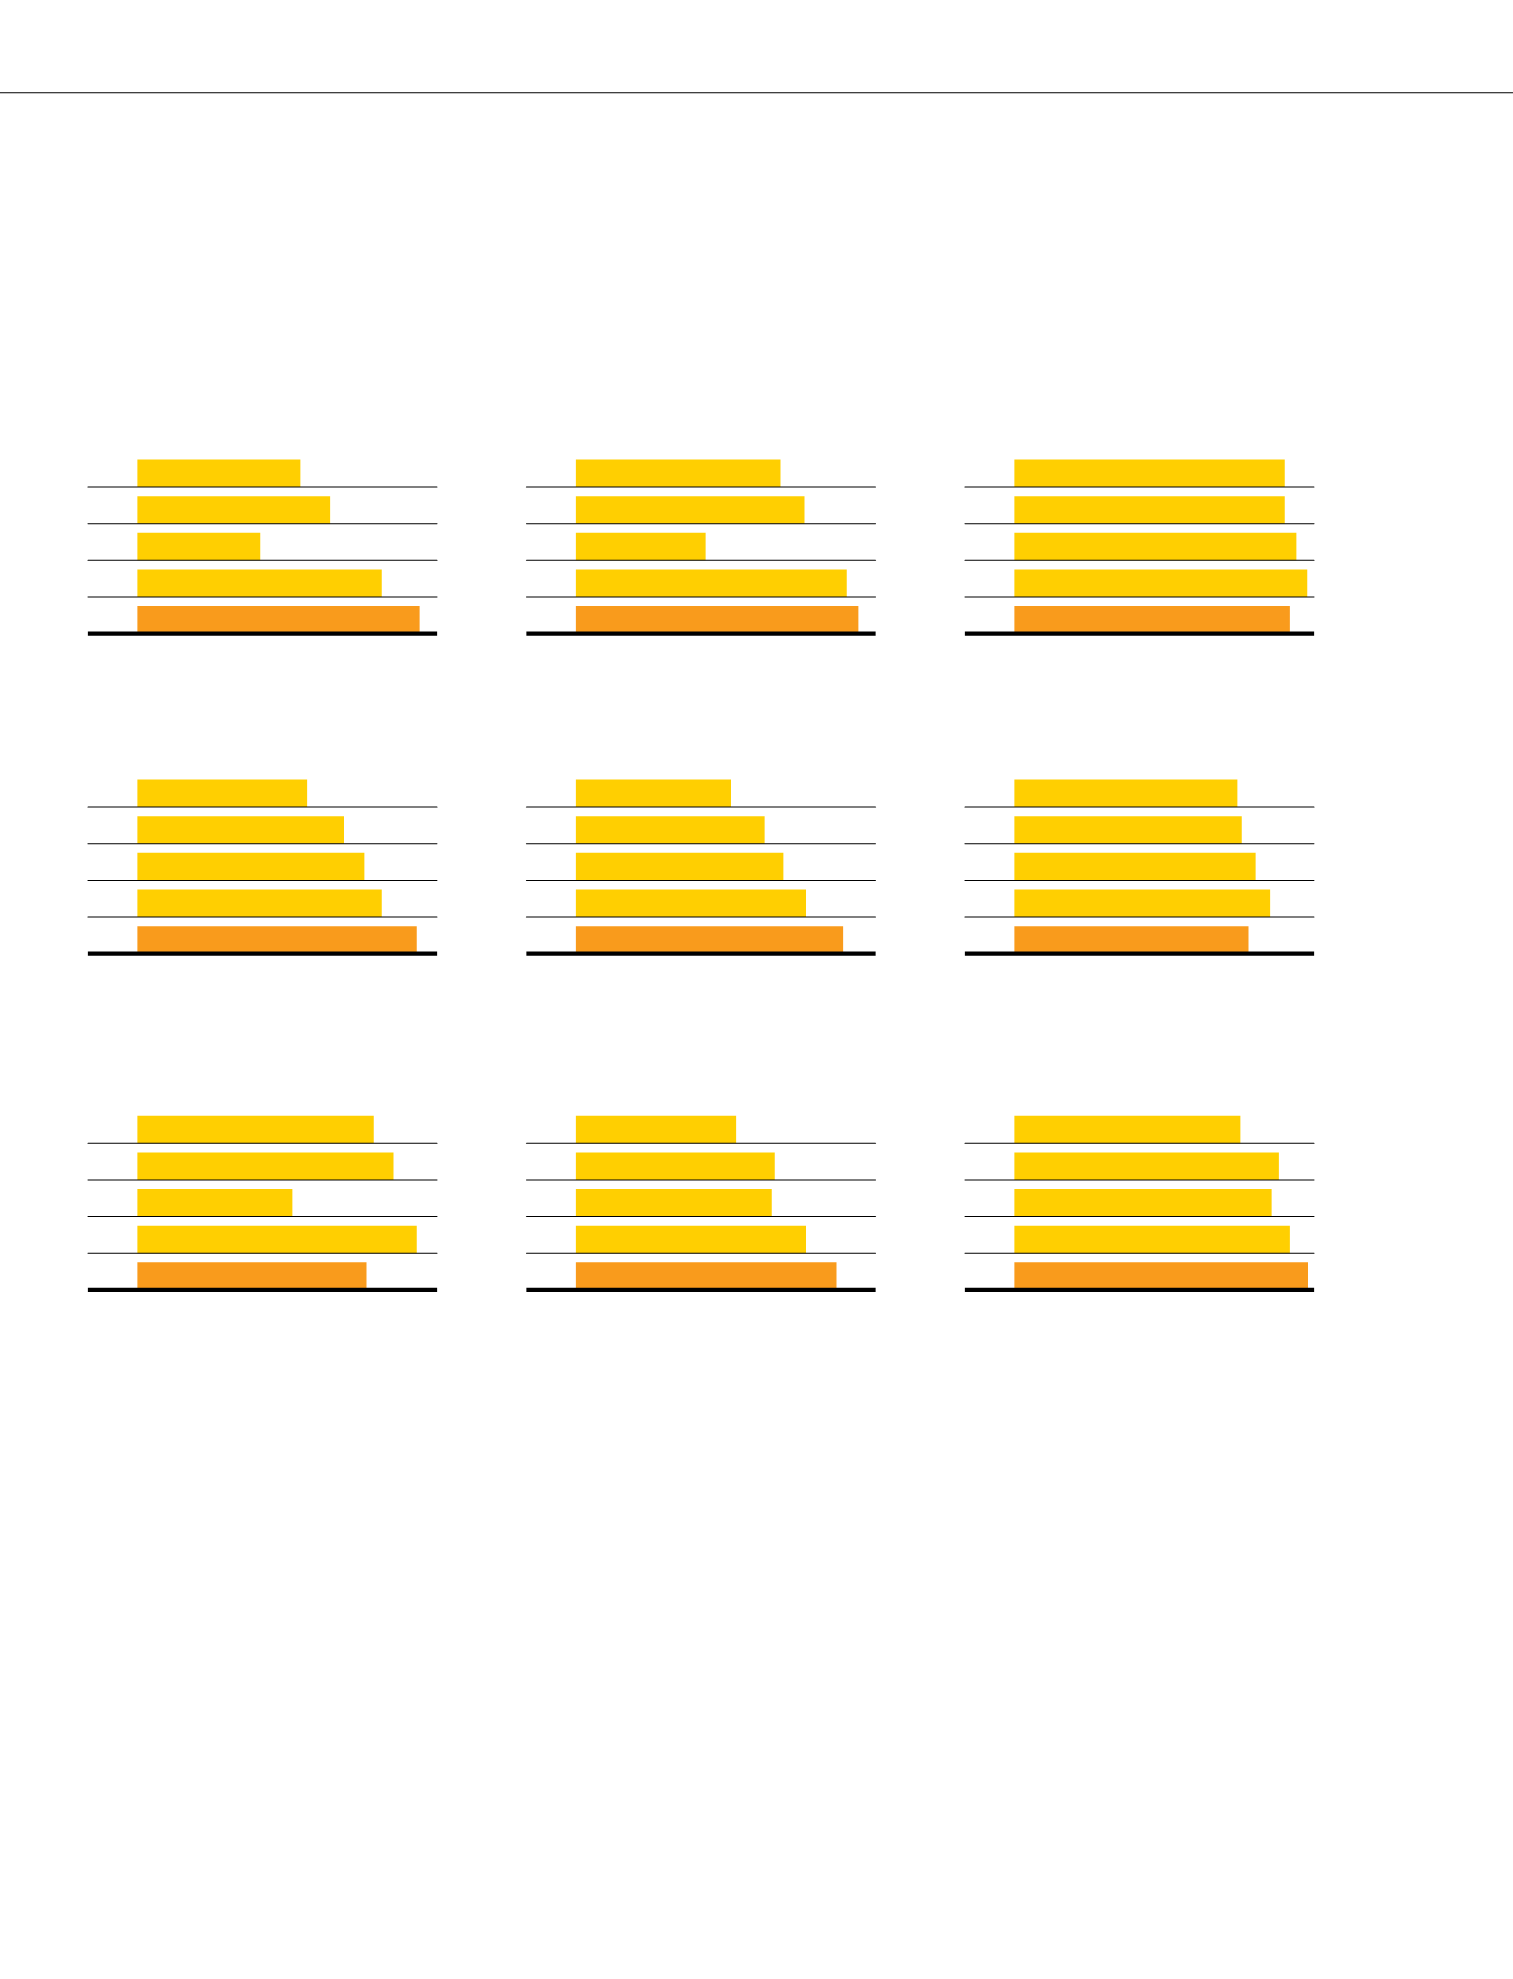
Profit Attributable to
Equity Holders of the Bank
RM6.55 billion
Earnings Per Share
75.8 sen
Return on Equity
15.1 %
3.82
4.45
2.59
5.75
6.55
53.9
61.4
34.5
72.7
75.8
FY10
FY11
FP11 *
FY12
FY13
FY10
FY11
FP11 *
FY12
FY13
FY10
FY11
FP11 *
FY12
FY13
14.5
14.5
15.2
16.0
#
15.1
336.7
411.3
451.6
494.9
560.4
205.9
255.0
276.3
311.8
355.6
FY10
FY11
FP11 *
FY12
FY13
FY10
FY11
FP11 *
FY12
FY13
FY10
FY11
FP11 *
FY12
FY13
14.58
^
15.36
^
16.37
^
17.35
^
15.664
@
Total Assets
RM560.4 billion
Loans, Advances and Financing
RM355.6 billion
Capital Adequacy Ratio
Total Capital Ratio: 15.664%
@
FY10
FY11
FP11 *
FY12
FY13
FY10
FY11
FP11 *
FY12
FY13
FY10
FY11
FP11 *
FY12
FY13
55.0
60.0
36.0
65.0
53.5
53.5
66.9
65.5
77.6
88.1
7.56
8.94
8.58
9.20
9.94
Gross Dividend Per Share
53.5 sen
Market Capitalisation
RM88.1 billion
Share Price
RM9.94
* Six-month financial period (FP) ended 31 December 2011 due to the change of financial year (FY) end from 30 June to 31 December.
# Computed based on weighted reallocation of additional RM3.66 billion capital raised in October 2012.
^ RWCR and assuming full reinvestment of DRP.
@ Total Capital Ratio (TCR) is computed in accordance with Capital Adequacy Framework (Capital Components) issued by Bank Negara Malaysia on 28 November 2012.
we see sustainabilitydifferently
G4-17


